Head to head / curated pair / cycle 04
Firebase Studio vs Convex Chef
Both products were given the identical 9 prompt vibeOps specification, 5 times each. Nothing on this page is an impression, all of it is a measurement from the same harness.

The widest integration surface of any builder we measured: auth, storage, scheduled functions and a managed datastore all attach without leaving the workspace. It pays for that in wall clock, since every prompt round trips through a provisioned cloud workspace rather than a local sandbox. Public pages came back client rendered unless server rendering was asked for by name, which is what holds the SEO subscore down.

The reactive backend underneath it does most of the work the operational prompts ask for, so scheduled functions, durable actions and consistent reads arrived without prompting. That is why it posts one of the best API subscores in the cohort despite a middling agent score. Where it struggles is anything conventionally relational: prompt 2 needed rework in three of five runs to express the tenancy constraint the way the platform prefers.
Index gap
7.56
Firebase Studio leads
Axes won
6 / 4
Firebase Studio versus Convex Chef, of ten axes
Faster median
Convex Chef
88.7 s per prompt
Higher pass rate
Firebase Studio
86.7%
Every measurement, side by side
Cyan marks the better figure on each row. The delta column is the first product minus the second.
| Measurement | Firebase Studio | Convex Chef | Delta |
|---|---|---|---|
| Composite index | 78.06 | 70.50 | +7.56 |
| Agent performance (weight 18) | 79.0 | 75.0 | +4.00 |
| Reliability (weight 18) | 86.7 | 60.0 | +26.70 |
| Scalability (weight 13) | 87.0 | 84.0 | +3.00 |
| SEO and GEO (weight 12) | 73.0 | 65.0 | +8.00 |
| API and MCP (weight 9) | 79.0 | 82.0 | -3.00 |
| Integrations (weight 8) | 90.0 | 72.0 | +18.00 |
| Design output (weight 7) | 72.0 | 76.0 | -4.00 |
| Speed (weight 7) | 31.3 | 35.4 | -4.10 |
| Value (weight 5) | 82.0 | 78.0 | +4.00 |
| Code ownership (weight 3) | 84.0 | 88.0 | -4.00 |
| Median seconds per prompt | 100.3 | 88.7 | +11.60 |
| p10 seconds | 65.8 | 51.5 | +14.30 |
| p90 seconds | 161.3 | 142.4 | +18.90 |
| Executions failed | 1 | 10 | -9.00 |
| HTML bytes, no JS | 22.0 KB | 12.0 KB | +10240.00 |
| LCP milliseconds | 1,980 | 1,840 | +140.00 |
| CLS | 0.050 | 0.040 | +0.01 |
| Entry price EUR | 0.00 | 25.00 | -25.00 |
Screenshot diff
Both landing pages, captured by the lab on 14 Aug 2026 at 1440 by 900. Stored locally, never hotlinked.
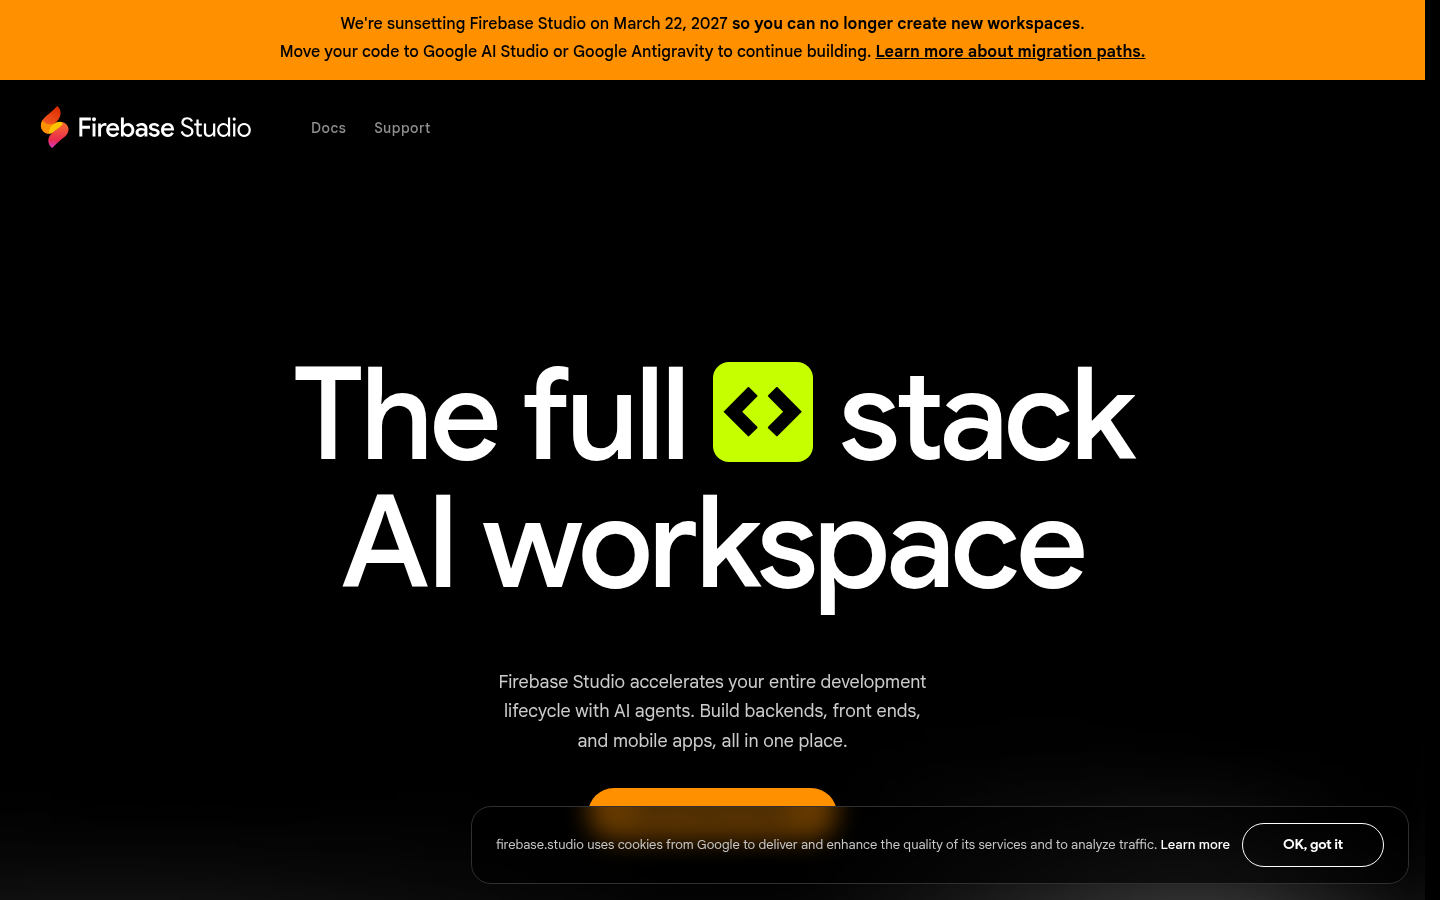
Firebase Studio, captured 14 Aug 2026.
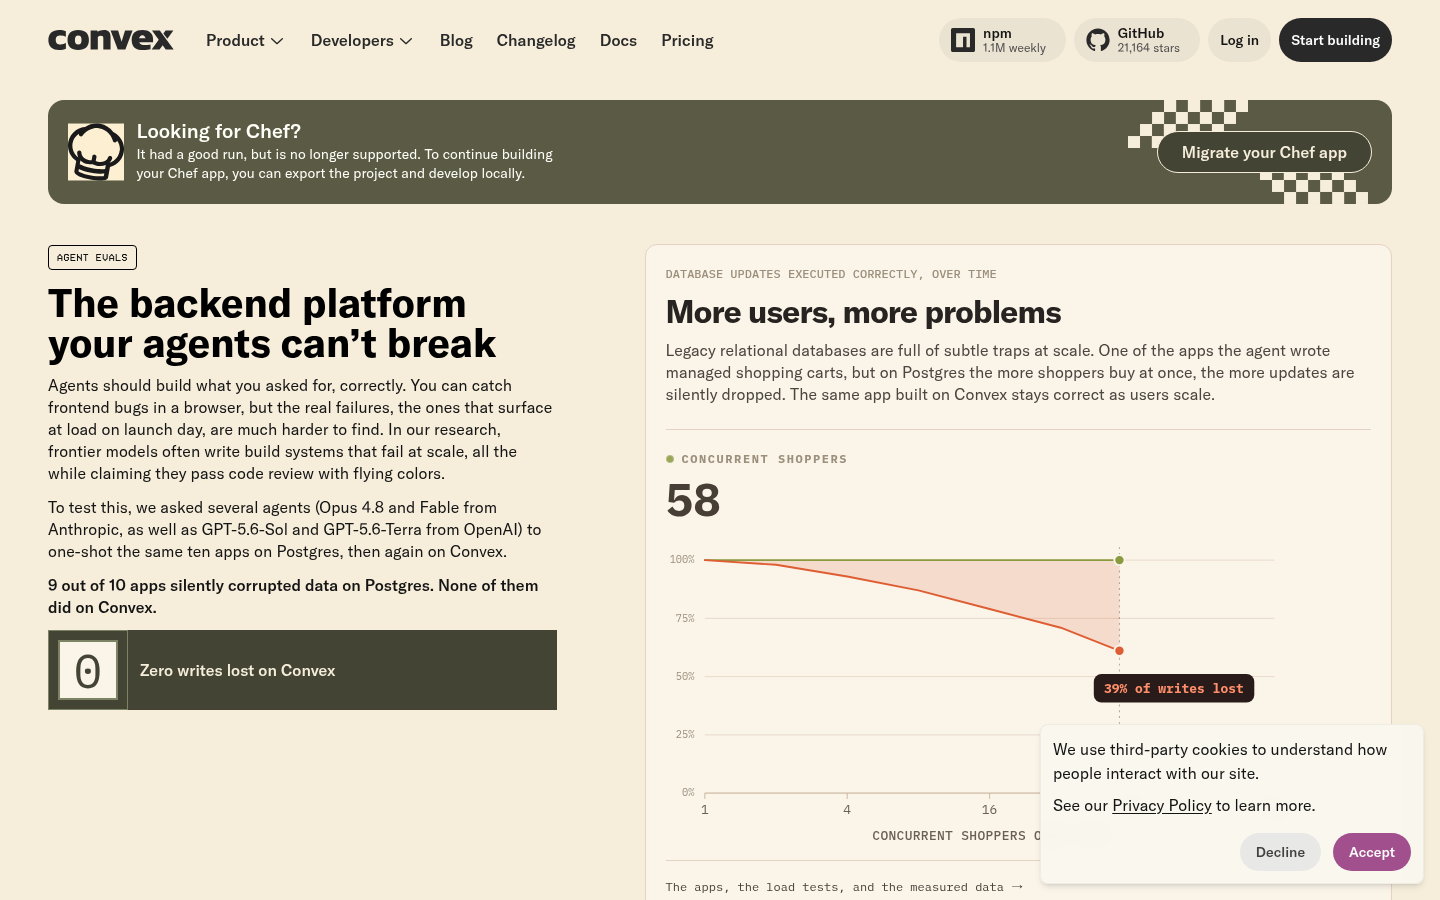
Convex Chef, captured 14 Aug 2026.
Speed spread on a shared scale
Firebase Studio
65.8 / 100.3 / 161.3 seconds
Convex Chef
51.5 / 88.7 / 142.4 seconds
Axis by axis, who wins
Firebase Studio wins 6 of 10
- Agent performance79.0
- Reliability86.7
- Scalability87.0
- SEO and GEO73.0
- Integrations90.0
- Value82.0
Convex Chef wins 4 of 10
- API and MCP82.0
- Design output76.0
- Speed35.4
- Code ownership88.0
Verdict
Firebase Studio takes the composite by 7.56 points. It wins on the weighted total, but the axis table is where the real decision sits: Firebase Studio takes 6 axes and Convex Chef takes 4.
If the work in front of you is mostly interface, weight the design and speed rows. If it is a product with an API, webhooks and background jobs, weight agent performance, reliability and the API and MCP row, which together carry 45 of the 100 index points. If the project has to outlive its vendor, read the code ownership row first and treat everything else as secondary.
Both products in this comparison were measured in the same cycle, on the same specification, by the same harness. The per run data for each is on its product page and in /api/runs.json.