Head to head / curated pair / cycle 04
Augment Code vs Cursor
Both products were given the identical 9 prompt vibeOps specification, 5 times each. Nothing on this page is an impression, all of it is a measurement from the same harness.

Indexes a whole repository before it acts, and on a large codebase that is worth the wait: it found the existing tenancy helper in prompt 3 and reused it rather than writing a second one, which no other agent did in every run. Pricing is flat for a team rather than per seat, so a single developer pays the same USD 20 as a team of fifty, which is what the value subscore reflects. On a small project the indexing advantage largely disappears.

The strongest edit loop we measured. It keeps a large working set in view, so the tenancy constraint from prompt 3 survived every later change without being restated. As a coding agent it produces no interface of its own, which caps the design subscore: what you get is exactly the quality of the framework and components you point it at. Everything it writes lands in your repository, so ownership is total.
Index gap
2.29
Cursor leads
Axes won
2 / 5
Augment Code versus Cursor, of 9 axes
Lower turn latency
Cursor
53.4 s per prompt
Higher pass rate
Augment Code
88.9%
Every measurement, side by side
Cyan marks the better figure on each row. The delta column is the first product minus the second.
| Measurement | Augment Code | Cursor | Delta |
|---|---|---|---|
| Composite index | 75.63 | 77.92 | -2.29 |
| Agent performance (weight 18.55) | 86.0 | 92.0 | -6.00 |
| Reliability (weight 18.56) | 88.9 | 86.7 | +2.20 |
| Scalability (weight 13.4) | 84.0 | 82.0 | +2.00 |
| SEO and GEO (weight 12.37) | 58.0 | 58.0 | +0.00 |
| API and MCP (weight 9.28) | 74.0 | 74.0 | +0.00 |
| Integrations (weight 8.25) | 76.0 | 80.0 | -4.00 |
| Design output (weight 7.22) | 62.0 | 66.0 | -4.00 |
| Turn latency score (weight 7.22) | 43.9 | 58.8 | -14.90 |
| Value (weight 5.15) | 77.0 | 80.0 | -3.00 |
| Median turn latency, seconds per prompt | 71.6 | 53.4 | +18.20 |
| p10 seconds | 44.9 | 28.7 | +16.20 |
| p90 seconds | 110.0 | 82.7 | +27.30 |
| Full spec, minutes, derived | 10.7 min | 8.0 min | +2.70 |
| Executions failed | 2 | 3 | -1.00 |
| HTML bytes, no JS | 22.0 KB | 24.0 KB | -2.0 KB |
| LCP milliseconds | 1,800 | 1,720 | +80.00 |
| CLS | 0.040 | 0.030 | +0.01 |
| Entry price | USD 20 / month, flat for a team up to 50 seats | USD 20 / month | n/a |
Screenshot diff
Both landing pages, captured by the lab on 14 Aug 2026 at 1440 by 900. Stored locally, never hotlinked.
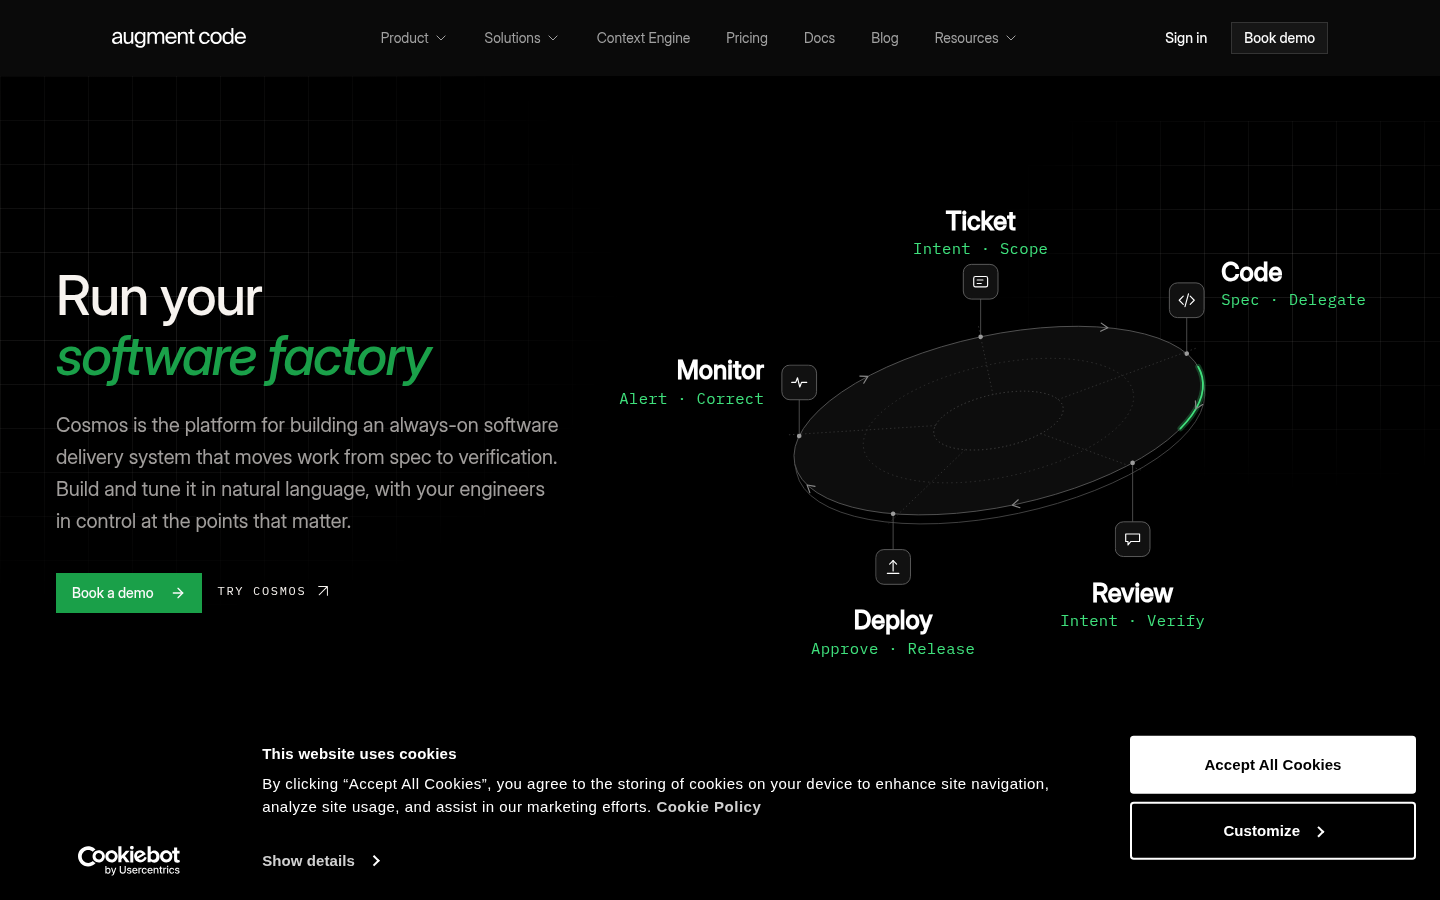
Augment Code, captured 14 Aug 2026.
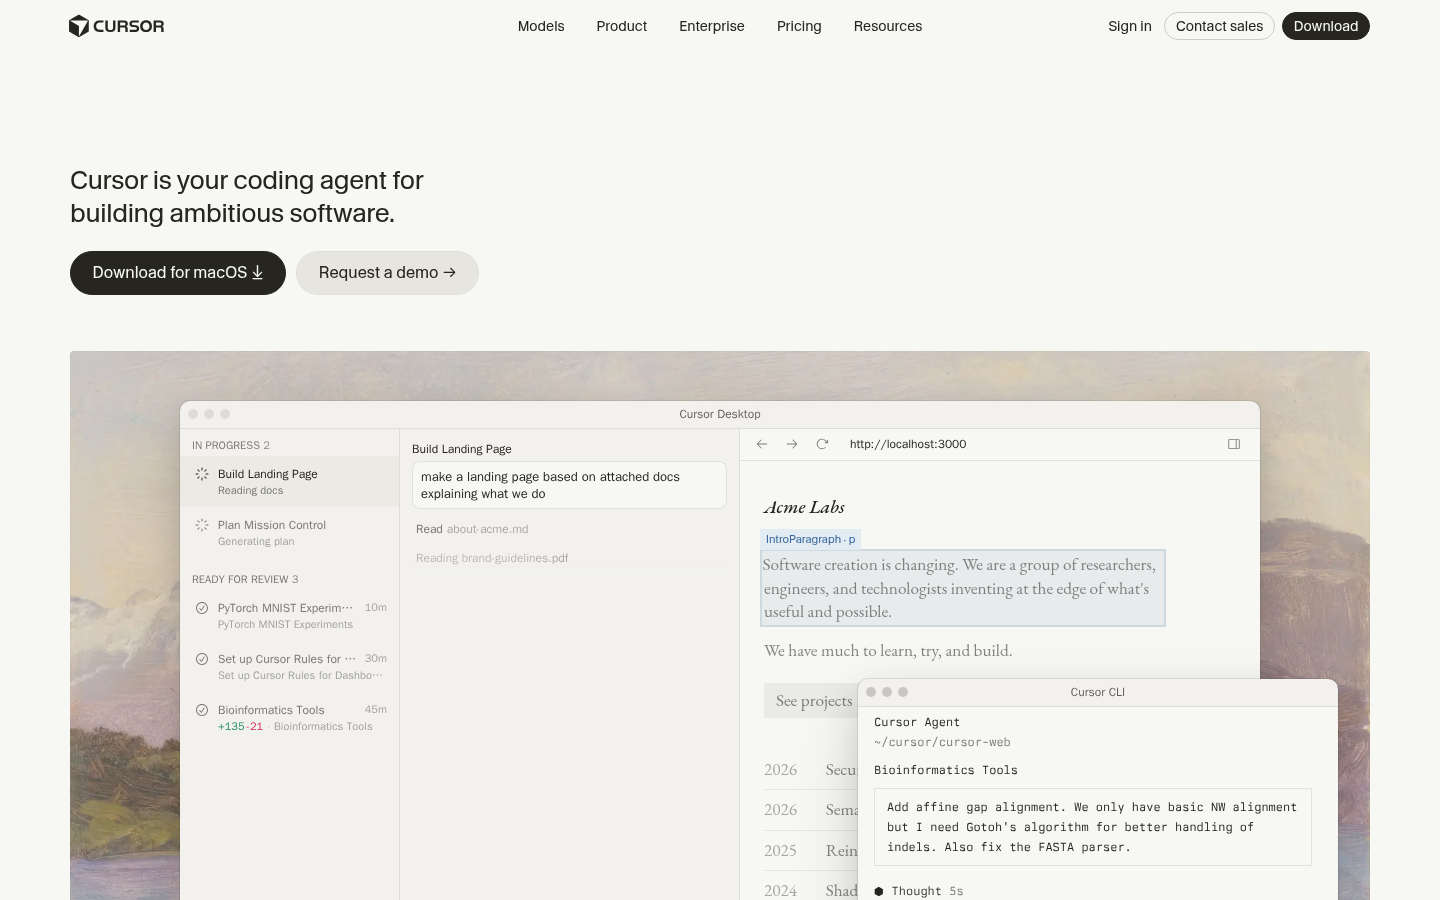
Cursor, captured 14 Aug 2026.
Speed spread on a shared scale
Augment Code
44.9 / 71.6 / 110.0 seconds
Cursor
28.7 / 53.4 / 82.7 seconds
Axis by axis, who wins
Augment Code wins 2 of 9
- Reliability88.9
- Scalability84.0
Cursor wins 5 of 9
- Agent performance92.0
- Integrations80.0
- Design output66.0
- Turn latency score58.8
- Value80.0
Verdict
Cursor takes the composite by 2.29 points. It wins on the weighted total, but the axis table is where the real decision sits: Augment Code takes 2 axes and Cursor takes 5.
If the work in front of you is mostly interface, weight the design and turn latency rows. If it is a product with an API, webhooks and background jobs, weight agent performance, reliability and the API and MCP row, which together carry 46.39 of the 100 index points on this board. This board does not score code ownership: a coding agent edits a repository you already own, so that property is never the vendor's to grant.
Both products in this comparison were measured in the same cycle, on the same specification, by the same harness. The per run data for each is on its product page and in /api/runs.json.