Head to head / curated pair / cycle 04
Devin vs Jules
Both products were given the identical 9 prompt vibeOps specification, 5 times each. Nothing on this page is an impression, all of it is a measurement from the same harness.

The slowest median in the index by a wide margin and the most expensive route through the spec, because it works in its own environment and takes the long way through every task. What it buys is unattended completion: it opened a pull request with passing tests without a human in the loop in four of five runs. Judged on the published axes the cost weighs heavily against it, which is why the value subscore is the lowest in the agent group.

An asynchronous agent: you hand it a task against a repository and come back to a proposed change. Judged on wall clock that is expensive, and it posts one of the slower medians in the index, but the comparison is not quite like for like since nobody sits and watches it. Change quality was good and the tests it added were real tests rather than assertions that always pass.
Index gap
1.40
Jules leads
Axes won
3 / 6
Devin versus Jules, of 9 axes
Lower turn latency
Jules
146.5 s per prompt
Higher pass rate
Jules
75.6%
Every measurement, side by side
Cyan marks the better figure on each row. The delta column is the first product minus the second.
| Measurement | Devin | Jules | Delta |
|---|---|---|---|
| Composite index | 66.64 | 68.04 | -1.40 |
| Agent performance (weight 18.55) | 78.0 | 80.0 | -2.00 |
| Reliability (weight 18.56) | 71.1 | 75.6 | -4.50 |
| Scalability (weight 13.4) | 80.0 | 74.0 | +6.00 |
| SEO and GEO (weight 12.37) | 54.0 | 55.0 | -1.00 |
| API and MCP (weight 9.28) | 72.0 | 66.0 | +6.00 |
| Integrations (weight 8.25) | 74.0 | 70.0 | +4.00 |
| Design output (weight 7.22) | 60.0 | 62.0 | -2.00 |
| Turn latency score (weight 7.22) | 8.9 | 21.4 | -12.50 |
| Value (weight 5.15) | 74.0 | 88.0 | -14.00 |
| Median turn latency, seconds per prompt | 353.6 | 146.5 | +207.10 |
| p10 seconds | 230.2 | 84.4 | +145.80 |
| p90 seconds | 651.4 | 292.7 | +358.70 |
| Full spec, minutes, derived | 53.0 min | 22.0 min | +31.00 |
| Executions failed | 6 | 4 | +2.00 |
| HTML bytes, no JS | 20.0 KB | 21.0 KB | -1.0 KB |
| LCP milliseconds | 1,900 | 1,860 | +40.00 |
| CLS | 0.050 | 0.040 | +0.01 |
| Entry price | USD 20 / month | No cost on the free tier | n/a |
Screenshot diff
Both landing pages, captured by the lab on 14 Aug 2026 at 1440 by 900. Stored locally, never hotlinked.
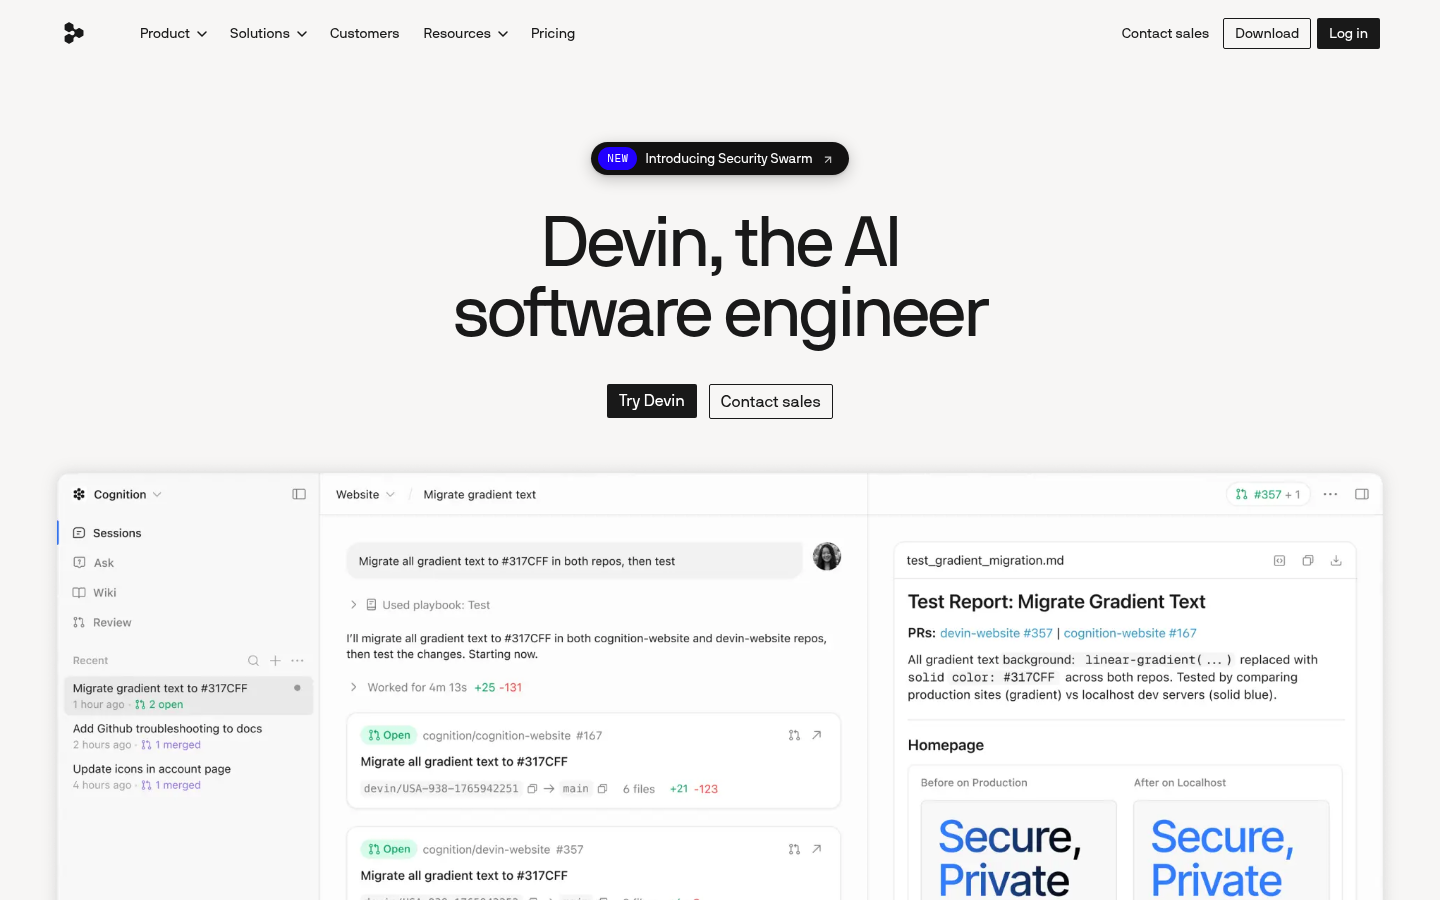
Devin, captured 14 Aug 2026.
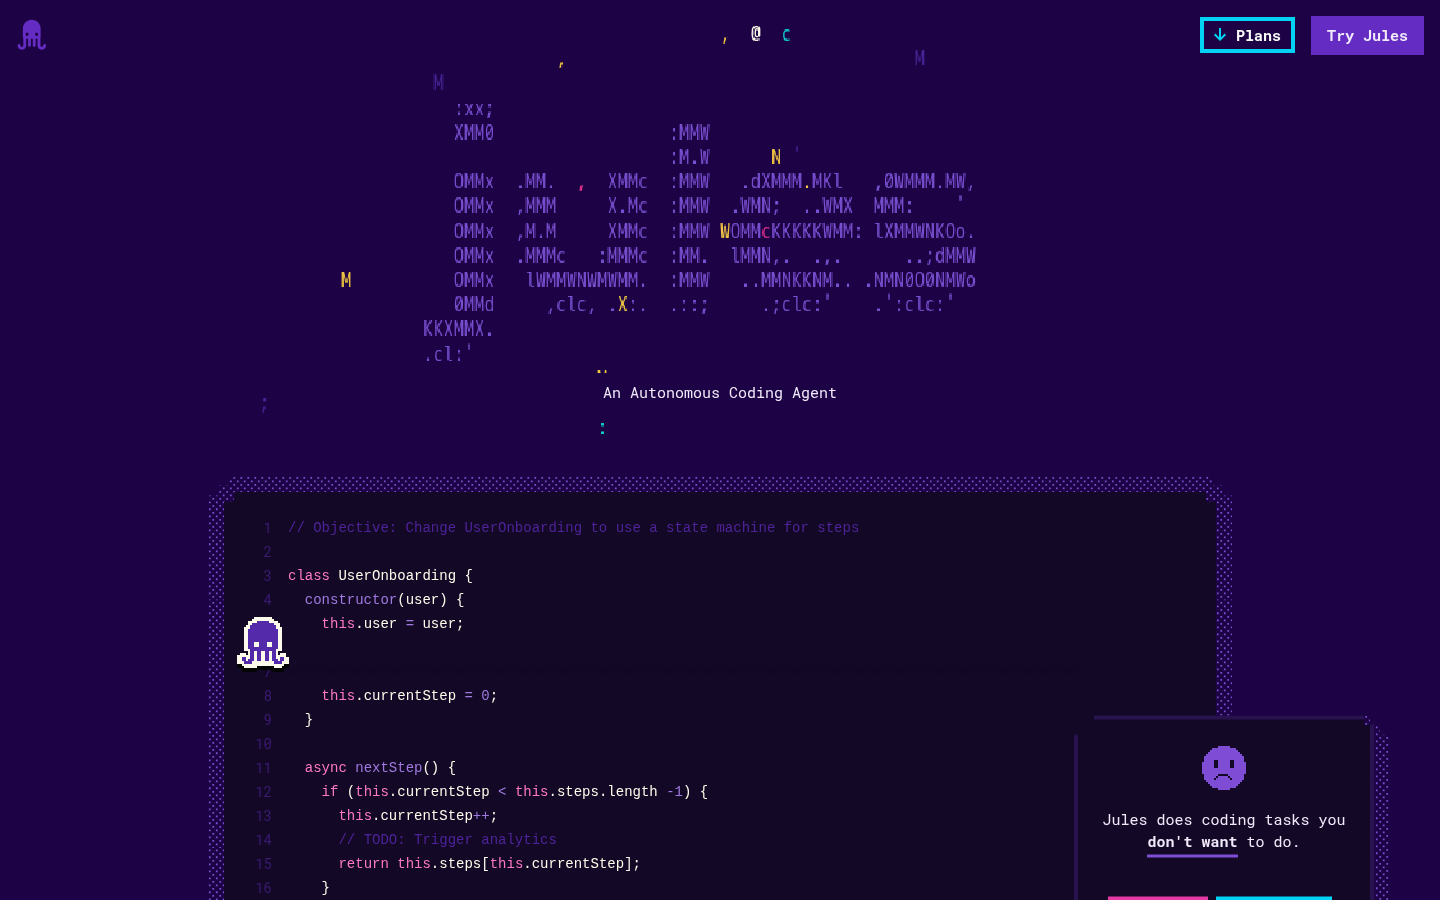
Jules, captured 14 Aug 2026.
Speed spread on a shared scale
Devin
230.2 / 353.6 / 651.4 seconds
Jules
84.4 / 146.5 / 292.7 seconds
Axis by axis, who wins
Devin wins 3 of 9
- Scalability80.0
- API and MCP72.0
- Integrations74.0
Jules wins 6 of 9
- Agent performance80.0
- Reliability75.6
- SEO and GEO55.0
- Design output62.0
- Turn latency score21.4
- Value88.0
Verdict
Jules takes the composite by 1.40 points. That is inside the noise of a five run sample, so the correct conclusion is that these two are tied on the composite and the choice should come down to a single axis you care about.
If the work in front of you is mostly interface, weight the design and turn latency rows. If it is a product with an API, webhooks and background jobs, weight agent performance, reliability and the API and MCP row, which together carry 46.39 of the 100 index points on this board. This board does not score code ownership: a coding agent edits a repository you already own, so that property is never the vendor's to grant.
Both products in this comparison were measured in the same cycle, on the same specification, by the same harness. The per run data for each is on its product page and in /api/runs.json.